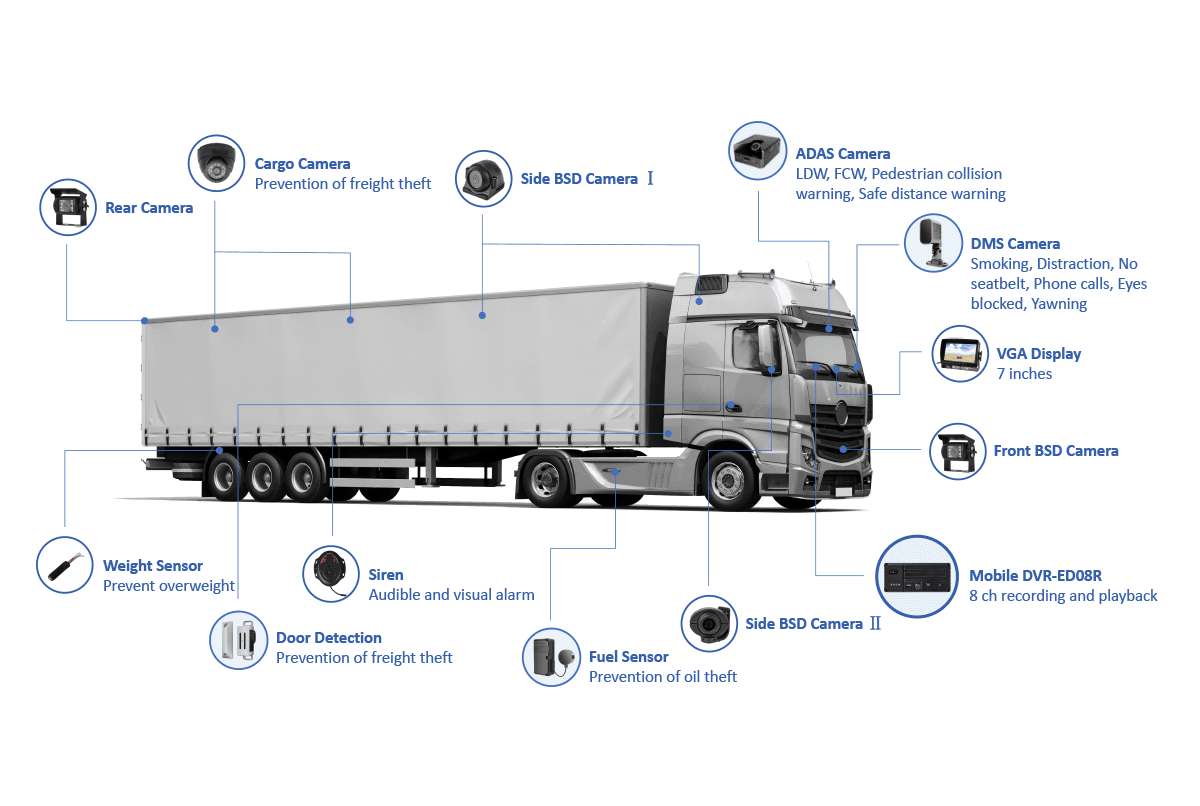
The framework presented here sets out explicit, testable steps for quantifying the return on investment (ROI) and operational value of mining fleet management programs. It treats vehicle assets as measurable systems rather than opaque cost centers and situates telemetry, maintenance, and utilization data within a repeatable decision process. The same logical sequence applies to heavy equipment and to other vehicular operations, including school bus fleet management, when one needs to convert telemetry into accountable outcomes.

Framework Overview: objectives, scope, and decision thresholds
Begin by defining three concrete objectives: capital efficiency (cost per productive hour), operational throughput (tons or tasks completed per hour), and risk reduction (incident- and compliance-related cost avoidance). Specify the scope—which asset classes, which shifts, and which contracts—and choose decision thresholds that will trigger action (for example, a 10% decline in utilization or a 7% year-over-year fuel-cost variance). These thresholds convert ambiguous goals into binary decisions: continue, remediate, or replace.
Four pillars for evaluation
Evaluation is organized around four pillars that collectively determine ROI and operational value:- Capital and operating cost accounting: capture acquisition costs, depreciation schedule, finance charges, fuel, planned maintenance, and unscheduled repairs.- Utilization and productivity: measure active time, load factor, and idle time normalized per asset and per haul cycle.- Safety and compliance: quantify incidents, regulatory fines, and downtime attributable to noncompliance.- Data and decision support: assess telemetry fidelity, analytics latency, and the decision rules that convert data into actions.Each pillar produces one or more key performance indicators (KPIs). The framework requires that every KPI be tied to monetary impact or to a clearly defined operational consequence.
Quantitative metrics and calculation methods
Use a small set of repeatable formulas rather than many ad-hoc ratios.- Total Cost of Ownership (TCO) per operating hour = (capital cost annualized + annualized fixed costs + annual operating costs) / annual operating hours.- Utilization rate = productive operating hours / available operating hours; present this per asset class and per shift.- Mean time between failures (MTBF) and mean time to repair (MTTR) should feed projected unscheduled downtime hours per year.- ROI (project) = (Present value of annualized benefits over project life − incremental costs) / incremental costs.Model sensitivity for top inputs (fuel price, utilization, failure rate) using a three-case approach: baseline, conservative, optimistic. The framework treats these outputs not as final judgments but as control variables for procurement, maintenance strategy, and operator training plans.
Data sources, validation, and telemetry integrity
Reliable evaluation depends on provenance and validation. Prioritize:- Telematics and CAN-bus data for engine hours, location, speed, and fault codes.- Maintenance logs with timestamps and parts used.- Fuel cards and reconciled fuel receipts.- Operational logs indicating load cycles and material moved.Validate telemetry against physical audits: random cross-check 5–10 assets monthly for odometer, fuel receipts, and maintenance entries. Deployments of telematics such as school bus gps tracking system demonstrate how continuous location and engine data materially shorten the audit cycle while improving anomaly detection; this trend aligns with the U.S. Department of Transportation’s school transportation safety initiatives that emphasize verifiable operational telemetry. Only one reconciled external anchor is used here to ground the relevance of telemetry to public-sector compliance and safety outcomes.
Translating metrics into operational levers
Metrics must map to concrete levers. Examples:- If utilization rate < threshold, institute route consolidation, shift reassignment, or idle-time limits.- If MTBF is declining, switch to condition-based maintenance for the affected subsystem and reallocate budget from scheduled replacements to predictive diagnostics.- If fuel cost variance exceeds model sensitivity, test geo-fence-based driver coaching and compare fuel burn before/after using a matched-pair statistical test.Document each lever with expected impact, required investment, and the measurement plan to confirm the predicted benefit within a defined period (typically 6–12 months).
Common pitfalls and diagnostic checks
Typical implementation errors erode both credibility and ROI estimates:- Over-reliance on vendor dashboards without access to raw data exports.- Mixing fiscal years when annualizing costs.- Using unvalidated driver-reported hours instead of telemetry-corroborated hours.- Applying single-asset improvements as proof for fleet-wide rollouts without statistical testing.Perform three diagnostic checks before approving major changes: data lineage verification, sensitivity analysis on top three inputs, and a pilot with control and treatment groups.
Comparative evaluation of alternatives
When comparing vendors or internal change programs, evaluate consistently across these dimensions: data accessibility, analytics transparency, implementation friction (weeks to pilot), and measurable impact on KPIs. Compare alternatives with a table of expected benefit streams over a three-year horizon and require that proposals state assumptions explicitly. Accept only those alternatives that disclose raw data formats and permit independent validation.

Synthesis and operational recommendation
Adopting this framework converts ambiguous promises into accountable decisions: calculate TCO and utilization, validate telemetry, choose interventions tied to quantified levers, and require pilots with statistical control. The approach privileges repeatable measurement over persuasive marketing and allows organizations to compare internal practice with documented implementations such as those delivered by BSJ, showing where investments lead to durable operational value rather than transient reporting improvements.